Key Operating Indicators of the Distribution Grid Sector
Electricity distribution services accounted for the largest share in the Group’s revenue in 2012 (84.72%). Other sources of revenue include network connection services and electricity sales.
TABLE 10. REVENUE OF THE GROUP
| 2012 | 2011 | |||
|---|---|---|---|---|
| Million Rubles | % of Total | Million Rubles | % of Total | |
| Electricity distribution | 526,656 | 84.72% | 552,634 | 87.08% |
| Network connection services | 44,592 | 7.17% | 40,099 | 6.32% |
| Electricity sales | 39,690 | 6.38% | 31,794 | 5.01% |
| Other revenue | 10,535 | 1.69% | 9,838 | 1.55% |
| 621,473 | 99.97% | 634,365 | 99.96% | |
| Government subsidies | 160 | 0.03% | 243 | 0.04% |
| 621,633 | 100.00% | 634,608 | 100.00% | |
Compared with 2011, revenue from electricity distribution services decreased by 4.70%. Government subsidies also were reduced: by 34.16% against 2011. Revenue decreased by 2.04%; however, the decrease in electricity distribution and government subsidies was set off by a rise in revenue from network connection services, electricity sales, and other revenue.
TABLE 11. OPERATING RESULTS OF THE GROUP
| 2012 | % of Total | 2011 | % of Total | |
|---|---|---|---|---|
| Electricity distribution | 214,475 | 37.35% | 220,969 | 38.28% |
| Personnel costs | 108,496 | 18.90% | 104,615 | 18.12% |
| Purchased electricity for compensation of technological losses | 74,300 | 12.94% | 94,663 | 16.40% |
| Depreciation and amortization | 61,499 | 10.71% | 54,075 | 9.37% |
| Purchased electricity for resale | 22,797 | 3.97% | 17,525 | 3.04% |
| Raw materials and supplies | 17,393 | 3.03% | 15,905 | 2.76% |
| Repairs, maintenance and installation services | 13,251 | 2.31% | 14,902 | 2.58% |
| Provisions | 9,194 | 1.60% | 4,750 | 0.82% |
| Impairment of trade and other receivables | 6,913 | 1.20% | 7,668 | 1.33% |
| Rent | 5,256 | 0.92% | 6,087 | 1.05% |
| Consulting, legal and audit services | 5,243 | 0.91% | 4,712 | 0.82% |
| Impairment of property, plant and equipment | 4,626 | 0.81% | – | – |
| Taxes other than income tax | 3,130 | 0.55% | 2,683 | 0.46% |
| Utility bills | 2,875 | 0.50% | 3,098 | 0.54% |
| Other expenses | 24,749 | 4.31% | 25,562 | 4.43% |
| 574,197 | 100.00% | 577,214 | 100.00% |
In 2012, electricity distribution expenses were down by 2.94% against 2011. Depreciation and amortization rose by 13.73% from 54,075 million rubles to 61,499 million rubles.
Payroll expenses and social security contributions in the reporting period increased by 3.76% and 3.81%, respectively. However, it should be noted that expenses related to the plan with established payments and expenses related to other long-term employee remuneration decreased by 33.68% and 110.76%, respectively.
Total operating expenses for 2012 remained almost unchanged against 2011, going down by only 0.52% and totaling 574,197 million rubles.
In 2012, net profit for the reporting period was 31,654 million rubles, or 18.77% less than in 2011 (38,966 million rubles). The net profit margin in 2012 was 5.09%, against 6.14% in 2011.
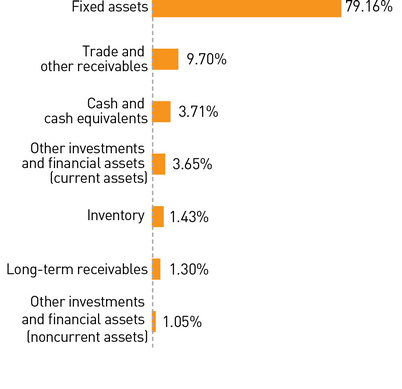
In 2012, total assets increased by 10.65% from 879,077 million rubles to 972,736 million rubles. Noncurrent assets rose by 9.62%: from 722,391 million rubles in 2011 to 791,849 million rubles in 2012.